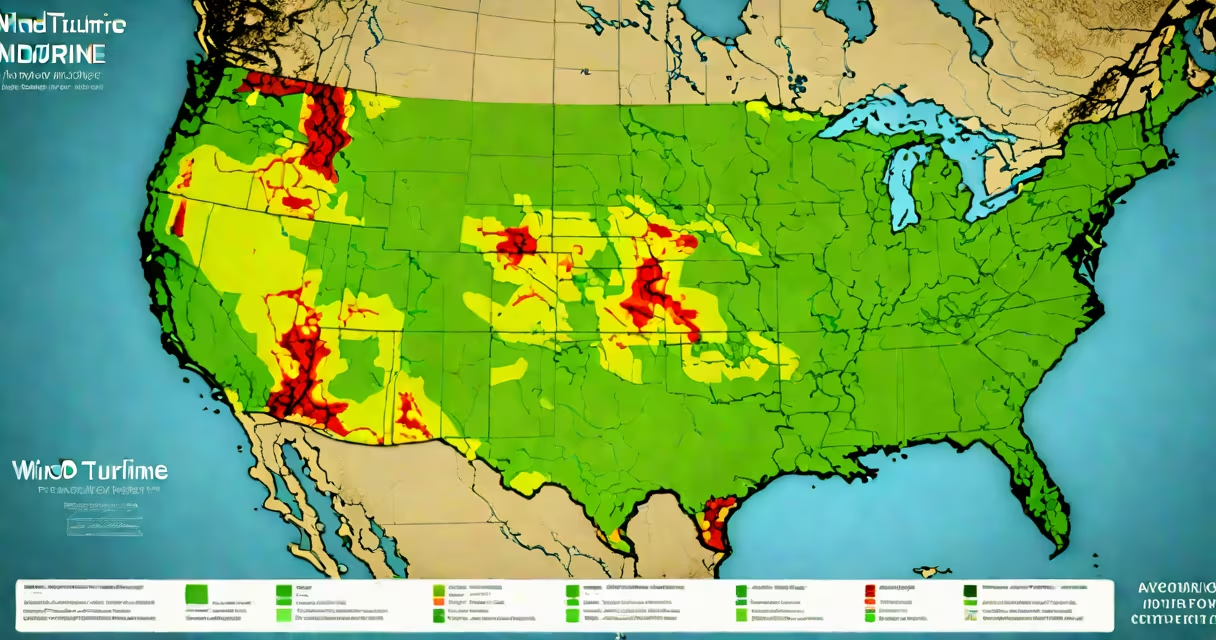
A wind turbine map displays the geographic distribution of wind turbines worldwide, showing installed capacity, project locations, and operational status. These maps visualize where wind power is being generated and help planners, researchers, and investors track renewable energy growth.
Wind turbine maps are digital tools that plot individual turbines or clusters of turbines on a geographic coordinate system. They often integrate real-time data, historical installation records, and projected expansion zones. The most detailed versions include metadata such as turbine model, nameplate capacity, year of commissioning, and operator details.
For example, the Global Wind Atlas, maintained by the Technical University of Denmark and the World Bank, provides free access to high-resolution wind resource data and overlays turbine locations based on publicly reported projects. This tool enables users to assess wind potential and existing infrastructure in the same interface.
These maps rely on geospatial databases compiled from public records, satellite imagery, and industry reports. Data sources include national energy agencies, environmental monitoring networks, and commercial platforms like OpenEI (Open Energy Information).
Each turbine location is assigned coordinates (latitude and longitude) and linked to attributes such as rotor diameter, hub height, and rated power. When displayed on a map, these points appear as icons or markers, often color-coded by capacity or age. Zooming in reveals individual turbines, while zooming out shows regional patterns.
Some advanced maps use heatmaps to show density. For instance, the U.S. Department of Energy's Wind Vision report includes a map layer highlighting areas with over 100 turbines per 100 square kilometers-primarily in Texas, Iowa, and California.
Different types serve distinct purposes. The following table outlines common categories:
| Type | Purpose | Data Source | Example |
|---|---|---|---|
| Global Installation Map | Track worldwide deployment trends | IEA Wind, Global Wind Atlas | globalwindatlas.info |
| National/Regional Map | Support local planning and policy | National energy agencies (e.g., EIA) | U.S. DOE Wind Energy Technologies Office map |
| Real-Time Operational Map | Monitor live output and performance | Utility SCADA systems, weather APIs | Wind Europe's live dashboard |
| Projected Development Map | Identify future sites and permits | Government permitting databases | California Energy Commission's wind permit tracker |
Not all maps are created equal. Some display only turbines above a certain size threshold-typically 1 megawatt (MW)-to avoid clutter. Others exclude offshore projects unless specifically filtered, which can misrepresent regional energy contributions.
Energy planners use wind turbine maps to evaluate grid integration feasibility. For example, in Germany, regional authorities use maps to determine whether new turbines can connect to existing transmission lines without requiring costly upgrades.
Environmental groups analyze these maps to assess ecological impacts. A 2022 study published in Nature Energy found that 63% of U.S. wind farms were located within 5 km of migratory bird routes. Maps helped pinpoint high-risk zones for avian collision, leading to revised siting guidelines in states like Wyoming and Montana.
Investors rely on wind turbine maps to identify emerging markets. In 2023, a private equity firm used a combination of turbine location data and wind speed models to select regions in northern Mexico for a $1.2 billion wind portfolio acquisition. The decision was based on maps showing low population density and high average wind speeds.
Many assume wind turbine maps show all operational turbines. That's false. Publicly available maps often omit small-scale or community-owned projects due to inconsistent reporting. According to the International Renewable Energy Agency (IRENA), only 68% of global wind capacity is documented in open-access databases as of 2023.
Another error is equating turbine density with efficiency. High-density areas don't always mean higher output. A 2021 analysis by the National Renewable Energy Laboratory (NREL) showed that spacing between turbines affects wake interference-where downstream turbines lose 10-15% of their energy yield. Maps that don't account for spacing may overestimate performance.
One non-obvious fact: many wind turbine maps do not distinguish between onshore and offshore turbines unless explicitly labeled. Offshore projects, particularly in the North Sea, have larger turbines (up to 15 MW) and different placement rules. A single offshore map layer can reveal how floating wind farms are expanding beyond traditional coastal zones.
Suppose you're evaluating a site in central Oregon for a new wind farm. You start with the U.S. Department of Energy's Wind Energy Data and Tools portal. You filter for "onshore" and "capacity > 2 MW." The map shows 14 turbines within a 10-kilometer radius, mostly clustered along a ridge line.
You cross-reference this with the National Renewable Energy Laboratory's Wind Prospector tool. It confirms that average annual wind speeds at 80 meters reach 7.8 m/s-above the 6.5 m/s threshold needed for economic viability. You also notice that no new permits have been issued in the area since 2020, suggesting limited regulatory risk.
Using this data, you estimate a 20-year lease cost of $1,200 per acre and calculate a levelized cost of electricity (LCOE) of $0.038/kWh. Based on the wind turbine map and supporting datasets, the site appears viable for a 50-turbine project.
During a field visit, you confirm that the terrain aligns with the map's elevation contours. The only discrepancy is a single turbine not listed in the database-likely a small, privately operated unit. You adjust your model accordingly and proceed with due diligence.