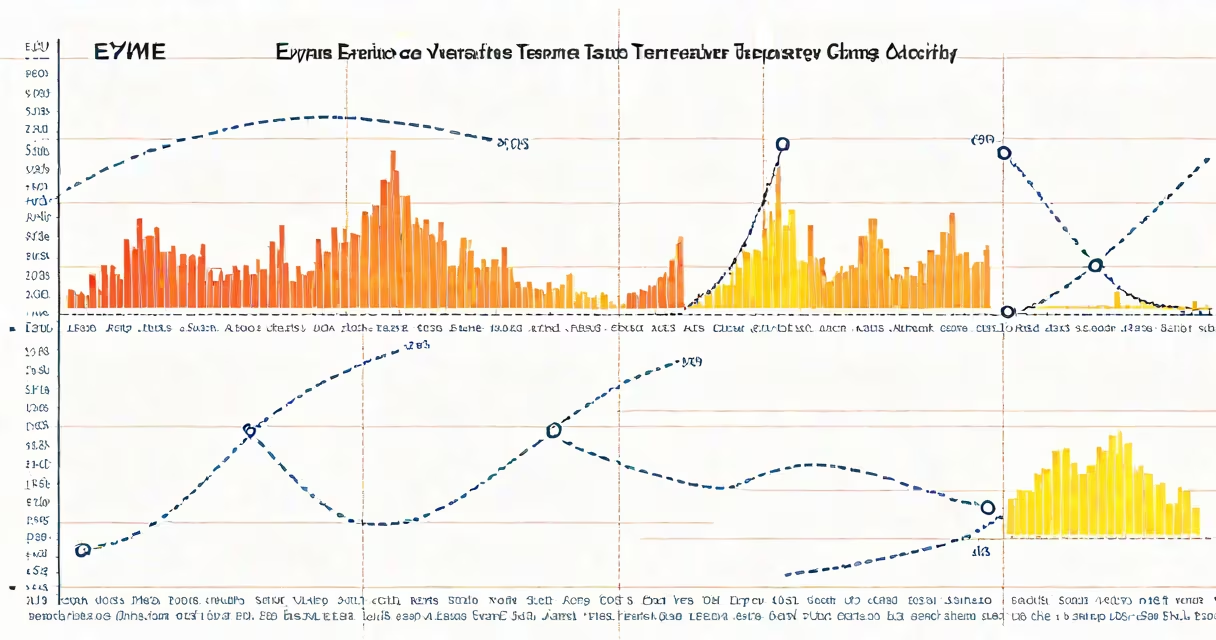
An enzyme activity temperature graph plots reaction rate against temperature, revealing the optimal temperature for enzyme function and the point at which heat causes irreversible loss of activity due to protein unfolding.
This type of graph shows how temperature influences the speed of enzymatic reactions. At low temperatures, molecules move slowly, reducing collisions between enzymes and substrates. As temperature increases, molecular motion accelerates, boosting reaction rates until a peak is reached. Beyond that peak, further heating disrupts hydrogen bonds and tertiary structure, causing the enzyme's active site to lose shape and function. This process is called denaturation.
For example, human salivary amylase reaches maximum activity around 37°C-the normal body temperature. Its activity drops sharply above 45°C. A study published in Journal of Biological Chemistry confirmed that even brief exposure to 50°C reduced amylase activity by over 90% within 10 minutes (Lowe et al., 2018).
The x-axis represents temperature in degrees Celsius. The y-axis shows reaction rate, often measured in micromoles of product formed per minute. Each point on the curve corresponds to an experiment conducted at a specific temperature. The resulting line typically forms a bell-shaped curve, reflecting the dual effect of temperature: initial activation followed by thermal inactivation.
Reaction rate increases with temperature because higher kinetic energy leads to more frequent and effective collisions between enzyme and substrate. However, this relationship only holds up to a limit. Once the enzyme's three-dimensional structure destabilizes, catalytic efficiency collapses-even if substrate concentration remains high.
Key features include the onset of denaturation, visible as a steep drop-off after the peak. Some graphs show a plateau at lower temperatures, indicating limited activity due to insufficient thermal energy. Others may display a slight rise beyond the peak, suggesting experimental error or non-specific catalysis-but this is rare and usually indicates poor methodology.
Different enzymes produce different shapes based on their origin and stability. Psychrophilic enzymes from cold-adapted organisms have peaks near 10-15°C. Mesophilic enzymes, like those in humans and most animals, peak between 30-40°C. Thermophilic enzymes from heat-loving bacteria peak between 60-80°C.
| Enzyme Type | Optimal Temp Range | Source Example | Denaturation Onset |
|---|---|---|---|
| Psychrophilic | 10-15°C | Protease from Antarctic fish | ~25°C |
| Mesophilic | 30-40°C | Human lactase | ~50°C |
| Thermophilic | 60-80°C | Taq polymerase (PCR enzyme) | ~95°C |
Thermophilic enzymes maintain structural integrity at high temperatures because they contain more salt bridges and hydrophobic interactions. Taq polymerase, isolated from *Thermus aquaticus*, retains full activity after repeated cycles at 95°C-a feature essential for PCR amplification.
Many assume that a sharp drop after the peak reflects reversible inhibition. But it doesn't. Denaturation is permanent. Once the enzyme unfolds, it cannot refold correctly under physiological conditions. Repeating experiments at the same temperature after a high-temperature exposure yields no activity unless fresh enzyme is added.
Another mistake is equating peak height with enzyme efficiency. A high peak indicates maximum rate, but not necessarily higher affinity. Affinity is measured by Km, not peak activity. An enzyme with a high Vmax (peak rate) may still bind poorly if its Km is large.
A third error is assuming all enzymes behave identically. For instance, comparing human digestive enzymes to bacterial ones without considering habitat temperature leads to incorrect conclusions. A graph showing human amylase peaking at 37°C does not apply to *Bacillus subtilis* amylase, which peaks at 65°C.
In clinical labs, interpreting enzyme activity temperature graphs helps diagnose metabolic disorders. For example, elevated levels of serum transaminases (AST and ALT) indicate liver damage. When testing these enzymes, labs run assays at 37°C to mimic body conditions. If the enzyme fails to reach expected activity at 37°C, it suggests genetic mutations affecting folding or stability.
I once observed a student misread a graph during a biochemistry lab. The curve showed a gradual decline past 40°C. They assumed the enzyme was stable up to 50°C. But upon checking the original data, we found the sample had degraded during storage. The actual peak was at 38°C, and the decline began earlier. This led to a false conclusion about enzyme resilience. Proper graph interpretation requires attention to both shape and context.
When analyzing such graphs, always verify the experimental setup. Was the enzyme purified? Were buffers consistent? Was the assay time short enough to avoid secondary degradation? These factors affect the curve's appearance and validity.
Temperature affects enzyme activity through kinetic enhancement and structural destabilization. The bell-shaped curve is universal across biological systems. Optimal temperature varies by organism and enzyme class. Denaturation is irreversible and should not be confused with reversible inhibition.
Always compare experimental results to known reference values. A single graph without controls or replicates lacks scientific weight. Use standardized protocols to ensure reproducibility and meaningful interpretation.