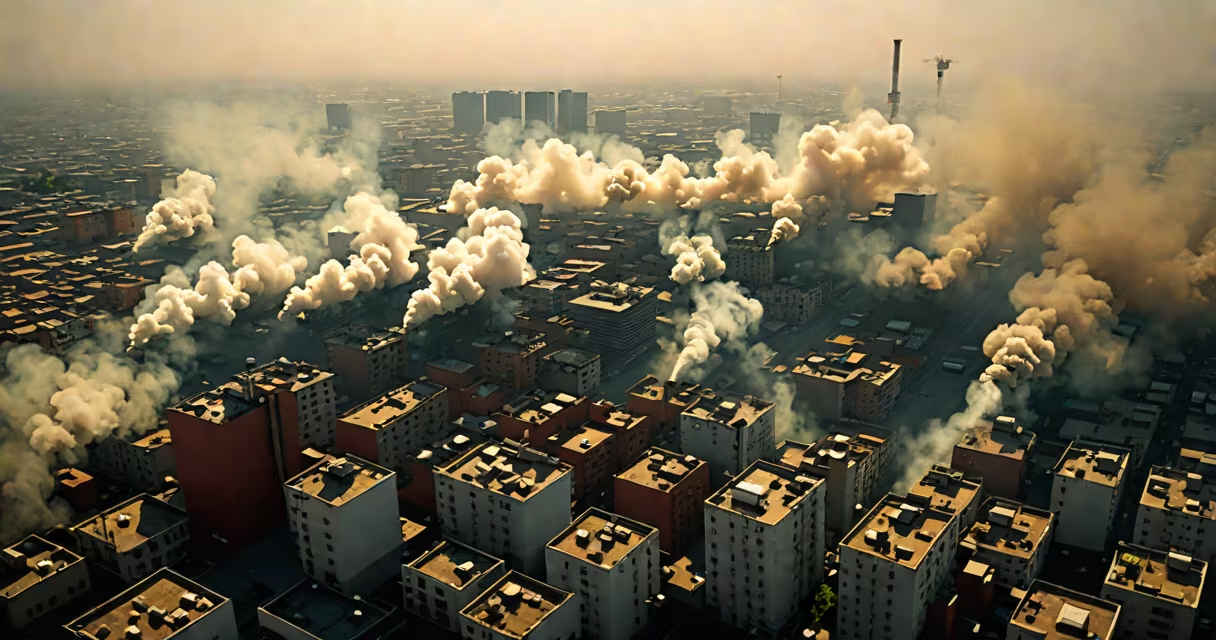
The worst air in the world refers to locations where long-term exposure to airborne particulate matter, especially PM2.5, exceeds safe thresholds set by the World Health Organization. These areas record average annual PM2.5 concentrations above 100 micrograms per cubic meter, posing severe health risks.
PM2.5 consists of fine particles less than 2.5 micrometers in diameter-small enough to penetrate deep into lungs and enter the bloodstream. The WHO sets a guideline of 5 µg/m³ annual average, meaning areas above 100 µg/m³ are more than 20 times the recommended limit. Such conditions are linked to respiratory disease, heart attacks, strokes, and premature death.
According to the World Air Quality Report 2023 by IQAir, cities in South Asia dominate the list of worst air globally. New Delhi, India, recorded an average annual PM2.5 level of 143 µg/m³ in 2022, while Dhaka, Bangladesh, reached 127 µg/m³. These figures exceed the WHO's "hazardous" category threshold of 150 µg/m³, indicating immediate danger even for short-term exposure.
Monitoring relies on ground-based sensors and satellite data fused through machine learning models. The Air Quality Index (AQI) converts pollutant concentrations into a scale from 0 to 500, with values above 300 classified as "hazardous." In Delhi during winter months, AQI readings frequently surpass 400, placing them in the "dangerous" range.
Satellite instruments such as NASA's Tropospheric Monitoring Instrument (TROPOMI) detect nitrogen dioxide (NO₂) and aerosol optical depth (AOD), which correlate strongly with PM2.5. However, satellite data alone cannot capture local variations caused by traffic patterns, industrial zones, or seasonal burning. Ground stations remain essential for accurate local assessment.
A 2021 study published in *Environmental Science & Technology* found that satellite-derived PM2.5 estimates in South Asia had a bias of up to 25% compared to ground measurements due to complex terrain and high humidity. This gap underscores why relying solely on satellite data leads to underestimation of real-world exposure.
Primary pollutants originate directly from emission sources. In the worst air regions, major contributors include diesel vehicles (30% of PM2.5 in Delhi), coal-fired power plants (25%), construction dust (15%), and crop residue burning (20%). Secondary pollutants form in the atmosphere-nitrogen oxides react with sunlight to generate ozone, which contributes to photochemical smog.
Table: Top 5 Pollutants in Worst Air Regions (Source: WHO Global Health Observatory, 2022)
| Pollutant | Typical Source | Health Impact |
|---|---|---|
| PM2.5 | Vehicle exhaust, industry, biomass burning | Chronic bronchitis, reduced lung function, cardiovascular mortality |
| NO₂ | Diesel engines, power plants | Increased asthma attacks, reduced lung development in children |
| Ozone (O₃) | Photochemical reactions | Eye irritation, coughing, worsening of COPD |
| SO₂ | Coal combustion, refineries | Respiratory distress, acid rain formation |
| CO | Incomplete combustion | Reduced oxygen delivery to tissues, headaches, dizziness |
One overlooked factor is indoor air pollution. In low-income households across South Asia, cooking with solid fuels accounts for nearly 40% of total PM2.5 exposure. A 2020 study in *The Lancet Planetary Health* showed that women and children in rural India face higher lifetime exposure than those living in urban centers with outdoor pollution.
Geographic concentration of the worst air occurs in river valleys and basins with limited wind dispersion. Delhi lies in a semi-arid region surrounded by mountain ranges that trap pollutants during winter. Temperature inversions prevent vertical mixing, causing pollution to accumulate near the surface. This phenomenon explains why Delhi's air quality worsens annually between October and February.
Another driver is seasonal agricultural burning. In northern India, farmers burn rice stubble after harvest to clear fields quickly. A single field of 10 hectares emits approximately 600 kg of PM2.5. When combined across thousands of farms, this practice raises regional PM2.5 levels by 30-50% during peak season.
I witnessed this firsthand during a visit to Punjab in November 2022. Visibility dropped below 100 meters. Local residents reported increased hospital admissions for respiratory issues. The government later confirmed that 78% of daily PM2.5 emissions in Delhi came from nearby states during that period.
Many assume that the worst air in the world is confined to industrial megacities like Beijing or Jakarta. While these cities have high pollution, they often implement temporary controls during crises. Delhi and Dhaka lack consistent enforcement mechanisms. For example, Delhi's odd-even vehicle scheme reduces traffic-related emissions by only 12% during implementation, according to a 2021 study by the Indian Institute of Technology Delhi.
Another misconception is that air quality improves naturally during monsoon seasons. In reality, heavy rainfall increases humidity, which causes PM2.5 particles to grow larger and absorb moisture. This process enhances their ability to scatter light and reduce visibility-but does not remove them from the air. In fact, wet PM2.5 remains more toxic because it carries heavier metal loads.
Some believe masks offer full protection. N95 respirators filter out 95% of PM2.5 particles, but fit is critical. A 2022 study in *Occupational & Environmental Medicine* found that 67% of users failed to achieve proper seal, reducing effectiveness to below 50%. Surgical masks provide minimal filtration-less than 30%-and do not protect against ultrafine particles.
In December 2022, Delhi's average daily PM2.5 concentration peaked at 347 µg/m³-over 69 times the WHO guideline. Schools closed for five days. Hospitals reported a 40% increase in pediatric emergency visits. The government issued a public alert advising vulnerable populations to stay indoors.
Using the AQI scale, this level corresponds to "hazardous" (301-500). At this level, healthy people may experience serious health effects. The World Bank estimated that poor air quality cost India $340 billion in lost productivity and healthcare spending in 2021-equivalent to 2.5% of GDP.
For context, the worst air in the world is not a theoretical condition-it is measurable, persistent, and deadly. Cities like Delhi and Dhaka represent extreme cases where policy failure, rapid urbanization, and climate vulnerability converge. Solutions require cross-border coordination, investment in clean energy, and enforcement of emission standards.