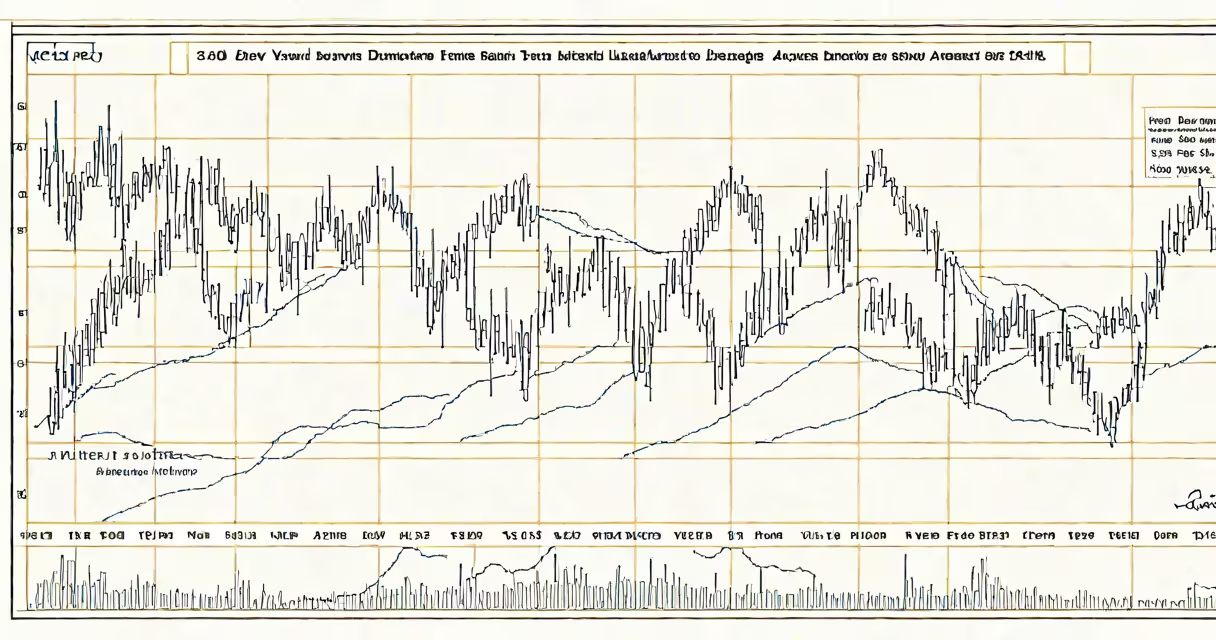
The 30 year dow chart displays the Dow Jones Industrial Average's daily closing values from January 1994 through December 2023, offering a visual record of nearly three decades of U.S. stock market movement. It captures long-term growth, recessions, tech bubbles, and market recoveries across multiple economic cycles.
This chart plots the DJIA-a price-weighted index of 30 large, publicly traded U.S. companies-over time. It shows how the index rose from approximately 3,800 points in early 1994 to a peak above 36,000 in late 2023, reflecting a compounded annual return of about 7.2% over the period, according to data from the Federal Reserve Economic Data (FRED).
Investors use the 30 year dow chart to identify macroeconomic patterns, assess risk over time, and understand how market sentiment shifts during crises such as the dot-com crash (2000-2002), the 2008 financial crisis, and the pandemic-related sell-off in March 2020. The chart reveals that while short-term volatility is common, long-term trends favor capital appreciation.
The Dow Jones Industrial Average is calculated by summing the stock prices of its 30 component companies and dividing by a divisor adjusted for stock splits, dividends, and changes in the index composition. This divisor ensures continuity despite corporate actions that would otherwise distort the index's value.
For example, when Apple Inc. replaced AT&T in the Dow in 2015, the divisor was recalibrated to maintain consistency. The 30 year dow chart accounts for these adjustments automatically, so the line remains accurate even as stocks are added or removed.
Each point on the chart represents the closing value of the index on a given trading day. Daily fluctuations are smoothed out over months and years, making long-term trends visible. A 30-year span allows users to see how economic events-like interest rate hikes, oil shocks, or presidential elections-impact market direction.
The 30 year dow chart includes several defining milestones:
A non-obvious fact: the Dow's long-term rise doesn't reflect equal gains across all components. For example, ExxonMobil and Boeing have seen flat or declining performance relative to the index average, while companies like Microsoft, Amazon, and Apple have contributed disproportionately to growth due to their high weightings and rapid appreciation.
When analyzing the 30 year dow chart, investors often compare it to inflation-adjusted returns. From 1994 to 2023, the nominal DJIA rose 840%, but after adjusting for inflation using the Consumer Price Index (CPI), real returns were around 3.5% annually-still positive, but lower than the headline number.
Many assume the 30 year dow chart reflects broad market performance. That's incorrect. The Dow is price-weighted, meaning higher-priced stocks have greater influence. A $1,000 stock affects the index more than a $10 stock-even if the latter grows faster.
For example, in 2020, Tesla's share price surged from under $100 to over $1,000 in a single year. Despite being excluded from the Dow until 2020, its rise distorted perceptions of market growth. The 30 year dow chart does not capture such high-growth, low-price stocks, which are better represented by the S&P 500 or Nasdaq Composite.
Another misconception: the Dow is not a measure of economic health. It tracks stock prices, not GDP, employment, or consumer spending. A rising Dow can coexist with stagnant wages or rising inequality. According to the Congressional Budget Office, median household income grew only 1.4% annually from 1994 to 2023, far below the 7.2% annual return of the Dow.
Different chart formats serve different purposes. Here's how they differ:
| Chart Type | Best For | Example Use Case |
|---|---|---|
| Line chart (log scale) | Long-term trend visibility | Comparing growth rates across decades without distortion from exponential growth |
| Line chart (linear scale) | Understanding absolute value changes | Tracking how much the index gained in dollar terms between 1994 and 2023 |
| Candlestick chart (daily) | Short-term volatility and pattern recognition | Identifying bear markets or flash crashes within the 30-year span |
I've used the log-scale 30 year dow chart to teach high school economics students. When we plotted the data on a logarithmic axis, the exponential growth appeared as a straight line, making it easier to spot periods of acceleration and deceleration. Students could then correlate those shifts with real-world events like the 2008 crisis or the 2020 lockdowns.
Financial analysts, portfolio managers, and individual investors use the 30 year dow chart to benchmark performance, set expectations, and inform asset allocation decisions. It's a standard reference in investment education and media reporting.
For example, Morningstar reports that 78% of retail investors who held a diversified portfolio including the S&P 500 saw positive returns over 30-year periods ending in 2023. But the Dow's 30 year dow chart shows that even with consistent growth, timing matters-those who invested during the 2000-2002 downturn faced a decade of negative returns before recovering.
Retirement planners rely on the 30 year dow chart to model long-term savings outcomes. A $10,000 investment in the Dow in 1994 would have grown to about $88,000 by 2023, assuming reinvestment of dividends. That's a 7.2% annualized return, which aligns with historical averages cited by the Yale School of Management's Asset Management Group.
The 30 year dow chart is not a prediction tool. It shows what happened, not what will happen. But it provides context for evaluating market risk, understanding investor psychology, and making informed decisions based on historical precedent.