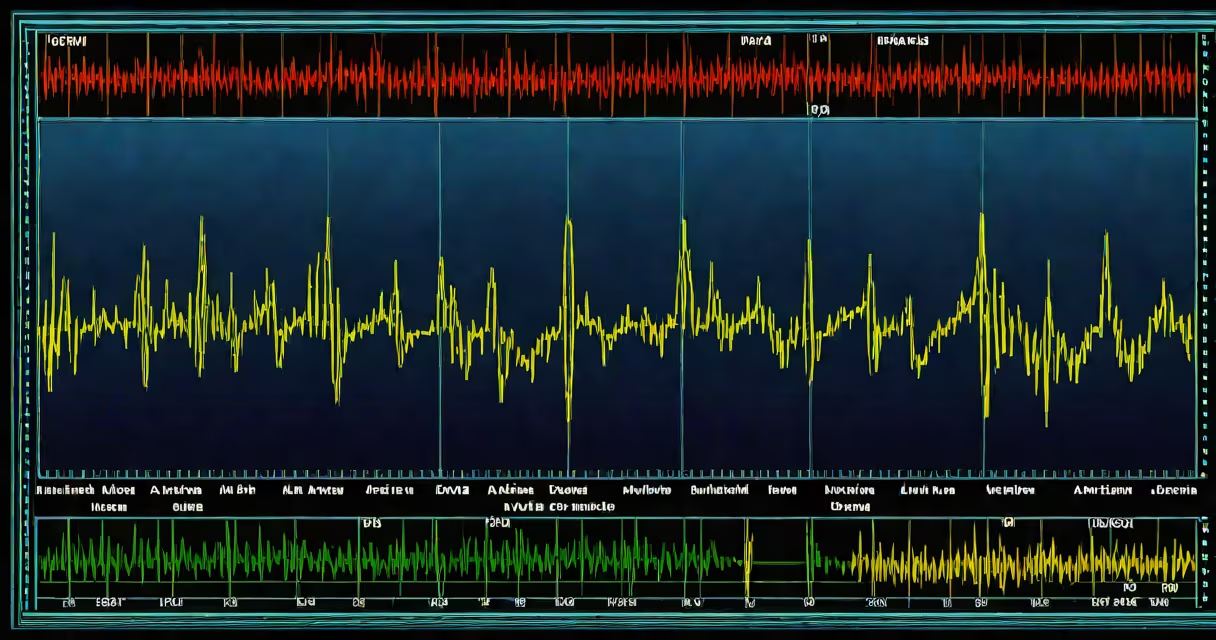
An arterial line waveform is a continuous, real-time graphical display of intravascular pressure recorded directly from an artery, typically via a catheter inserted into the radial, femoral, or brachial artery. It provides immediate insight into systolic and diastolic pressures, heart rate, and vascular tone, enabling clinicians to assess hemodynamic stability during surgery, intensive care, or acute illness.
The waveform is generated by a transducer connected to a catheter placed in an artery. The system converts mechanical pressure changes into electrical signals, which are then filtered and displayed on a monitor. This allows for beat-to-beat tracking of blood pressure, unlike intermittent cuff measurements, which only capture snapshots every few minutes.
For example, in a trauma patient with hypotension, a rapidly declining arterial line waveform may indicate internal bleeding or cardiac tamponade. In contrast, a high-amplitude, narrow waveform suggests hypertension or vasoconstriction. These visual cues enable faster clinical decisions than relying solely on manual readings.
The arterial line system uses a fluid-filled catheter connected to a pressure transducer. When blood pulses through the artery, it exerts force on the fluid column inside the catheter. The transducer detects minute pressure changes and sends them to a monitor, which plots them as a waveform.
Proper setup requires the transducer to be level with the patient's heart (typically at the fourth intercostal space, midaxillary line) to avoid hydrostatic errors. If the transducer is too high, pressure readings appear falsely low; if too low, they appear falsely high. Calibration using a standard pressure source ensures accuracy.
A properly functioning system produces a sharp, well-defined waveform with identifiable features: a rapid upstroke (systolic peak), a dicrotic notch (closure of the aortic valve), and a gradual downslope (diastolic phase). Abnormal shapes-such as a flattened upstroke or absent notch-can signal poor cardiac output, hypovolemia, or catheter displacement.
The arterial line waveform contains several clinically significant elements:
For instance, a patient with septic shock may show a low MAP (<65 mmHg), a widened pulse pressure (>60 mmHg), and a blunted dicrotic notch due to reduced contractility and vasodilation. These findings prompt early vasopressor therapy.
Arterial line waveforms are used primarily in settings requiring continuous, precise hemodynamic monitoring. Common applications include:
| Setting | Use Case | Why It Matters |
|---|---|---|
| Operating room | Monitoring during major surgery | Immediate detection of hypotension or arrhythmias during anesthesia |
| ICU | Management of sepsis, shock, or ARDS | Guides fluid resuscitation and vasopressor titration |
| Emergency department | Trauma or acute cardiovascular events | Replaces unreliable oscillometric cuffs in unstable patients |
Arterial lines are not used for routine outpatient blood pressure checks. They are reserved for critically ill patients where accuracy and speed are essential. A study published in Critical Care Medicine found that arterial line monitoring reduced the time to intervention in hemorrhagic shock by an average of 14 minutes compared to intermittent NIBP (non-invasive blood pressure) measurements.
Many assume the arterial line waveform reflects only blood pressure. In reality, it reveals much more: stroke volume, vascular compliance, and even cardiac rhythm. For example, a pulsus paradoxus-a drop in systolic pressure during inspiration-is visible as exaggerated respiratory variation in the waveform and indicates cardiac tamponade or severe asthma.
A frequent error is mistaking a flat waveform for equipment failure. In truth, a flat trace often results from catheter dislodgement, clot formation, or air bubbles in the line. The solution is not to replace the transducer but to check the catheter site and flush the line with heparinized saline. A 2021 review in Journal of Clinical Monitoring and Computing reported that 38% of "failed" arterial line readings were due to technical issues rather than physiological causes.
Another misconception is that all waveforms look the same. In reality, waveform morphology varies between patients and conditions. A young, healthy individual may have a tall, narrow waveform with a prominent dicrotic notch. An elderly patient with arteriosclerosis may show a dampened waveform with a delayed upstroke and flattened notch due to stiff arteries.
During a surgical rotation, I once misinterpreted a waveform as indicating hypovolemia. The patient had a low systolic pressure and a wide pulse pressure. After flushing the line and confirming proper placement, we discovered the issue was a kinked catheter-not low volume. This taught me that waveform interpretation must always consider both physiology and technique.
An arterial line waveform is not a substitute for echocardiography or pulmonary artery catheterization. It does not measure cardiac output directly. However, it can inform decisions about fluid administration and vasopressor use. For example, a rising systolic pressure after fluid bolus suggests volume responsiveness. A lack of change may indicate the need for vasopressors instead.
It is also not the same as a pulse oximetry waveform. While both are waveforms, pulse oximetry measures oxygen saturation and perfusion, not pressure. Confusing the two can lead to misdiagnosis. A pulse oximeter shows a plethysmographic signal that fluctuates with each heartbeat, but it lacks the amplitude and timing details of an arterial line waveform.
Finally, arterial line waveforms are not always accurate. Factors such as catheter size, insertion site, and patient movement affect signal quality. A 20-mmHg difference in systolic pressure between an arterial line and a non-invasive cuff is normal due to damping effects in the arterial wall. But a consistent discrepancy greater than 10 mmHg warrants troubleshooting.