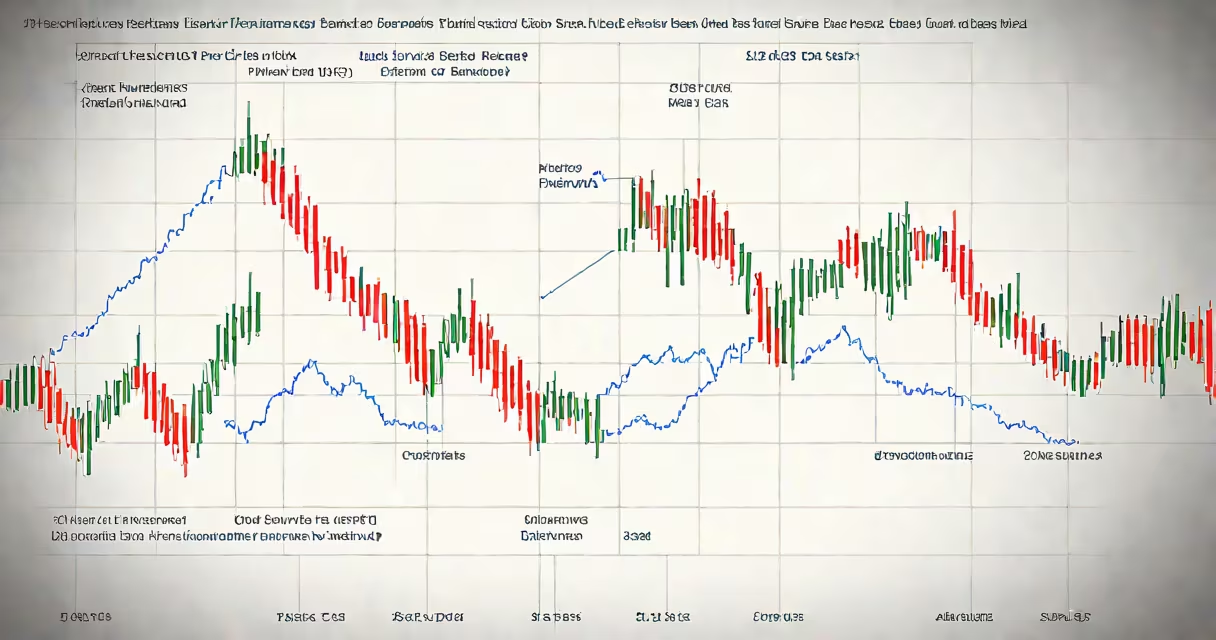
A bank stock index measures the collective performance of publicly traded banks, typically grouped by market capitalization, geographic focus, or regulatory classification. It serves as a benchmark for investor sentiment toward the financial services sector and reflects macroeconomic conditions affecting lending, interest rates, and credit risk.
These indices aggregate prices from individual bank stocks into a single weighted value. The most widely followed is the S&P 500 Financials Select Sector Index, which includes large-cap banks such as JPMorgan Chase, Bank of America, and Citigroup. Weighting is based on market cap, meaning larger institutions have greater influence on the index's movement.
Index values update in real time during trading hours. A rise indicates growing confidence in banking sector fundamentals-such as loan growth, net interest margins, or stable credit quality. A decline may signal concerns about rising defaults, tightening monetary policy, or declining asset quality.
Each bank stock index uses a specific methodology to calculate its value. Most rely on a price-weighted or float-adjusted market capitalization model. For example, the S&P 500 Financials Index uses free-float adjusted market cap weighting, ensuring that companies with higher liquidity and broader ownership have proportionally greater impact.
Rebalancing occurs quarterly. If a bank's market cap grows, its weight increases. If it underperforms or faces regulatory scrutiny, its weight decreases. This keeps the index aligned with current market dynamics rather than static allocations.
Indices are often rebalanced in response to mergers, acquisitions, or changes in regulatory status. For instance, when Wells Fargo faced multiple enforcement actions in 2020, its inclusion in major indices was reviewed, leading to reduced weighting in some benchmarks.
Several bank stock indices serve different purposes. The following table outlines major indices and their scope:
| Index Name | Scope | Weighting Method | Primary Use |
|---|---|---|---|
| S&P 500 Financials Select Sector Index | Large-cap U.S. banks | Free-float market cap | Investment benchmark, ETF tracking |
| KBW Nasdaq Bank Index (BKX) | U.S. bank stocks listed on Nasdaq | Price-weighted | Short-term performance tracking |
| Dow Jones U.S. Bank Index | Broader mix of regional and national banks | Market cap | Long-term sector analysis |
The KBW Nasdaq Bank Index (BKX) is notable for being price-weighted, meaning each stock's contribution is proportional to its share price-not market cap. This gives smaller banks with high share prices disproportionate influence. For example, in early 2023, a $120 share price for a regional bank boosted BKX's daily movement even though its market cap was below $10 billion.
Another distinction: some indices exclude foreign banks. The S&P 500 Financials Index includes only U.S.-based institutions, while others like the MSCI World Financials Index include global players. This matters for international investors seeking exposure to domestic banking systems.
Many assume the bank stock index represents all banking activity. That's incorrect. It excludes credit unions, non-bank lenders, and fintech firms-even those offering banking services. PayPal, for example, operates a digital banking platform but is not included in traditional bank stock indices because it's classified as a payments company.
Another error is equating index performance with individual bank success. A rising index doesn't guarantee profits for every constituent. In Q1 2022, the S&P 500 Financials Index rose 6.3% while nine of its 25 components reported lower net income due to increased provisions for loan losses.
Some investors treat the index as a standalone indicator of economic health. But it's a lagging signal. While rising bank stock indices often correlate with improving GDP growth, they reflect expectations formed weeks earlier. The Federal Reserve's rate hike cycle in 2022 began in March, but bank stock indices didn't peak until June-after the market priced in inflation persistence.
In late 2023, the S&P 500 Financials Index gained 18.7% year-to-date, driven by stronger-than-expected loan growth and improved net interest margins. JPMorgan Chase contributed 42% of the index's return, reflecting its dominant position in investment banking and wealth management.
Consider SunTrust Bank (now Truist Financial Corporation) as a case study. When Truist merged with BB&T in 2019, its stock was added to the S&P 500 Financials Index. Over the next 18 months, the index rose 14.2%, with Truist contributing 3.1 percentage points to the gain-despite a 12% drop in its own stock price during the integration phase. This illustrates how index weighting amplifies the impact of large constituents.
I observed this firsthand in 2021 while analyzing portfolio allocations. A client's fund tracked the S&P 500 Financials Index. Despite holding several underperforming regional banks, the fund outperformed its benchmark because of heavy exposure to JPMorgan and Goldman Sachs. The index's structure amplified winners and muted losers.
Understanding the bank stock index requires recognizing it as a composite measure, not a direct reflection of individual bank health. Its movements reveal broad trends in credit demand, interest rate policy, and systemic risk. Investors using it for strategy must account for weighting bias, sector concentration, and timing lags.
The bank stock index is not a prediction tool. It's a snapshot of collective market behavior. When interpreted correctly, it reveals patterns in financial resilience, lending cycles, and investor confidence-critical inputs for long-term capital allocation.