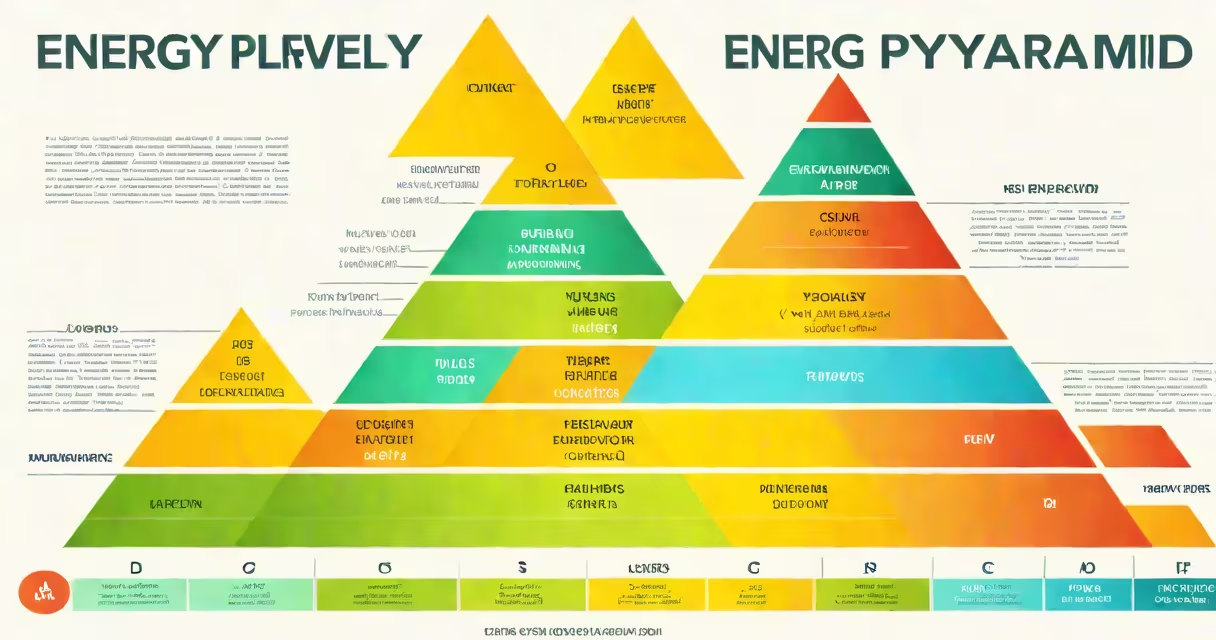
Energy pyramid levels illustrate how energy flows through an system, with each level representing a trophic group-producers, primary consumers, secondary consumers, and tertiary consumers-where energy decreases by about 90% at each step due to metabolic loss.
Energy enters ecosystems primarily through photosynthesis. Plants and other autotrophs convert sunlight into chemical energy stored in organic compounds. This forms the base of the energy pyramid. When herbivores eat plants, they gain only a fraction of the energy originally captured. The rest is lost as heat, waste, or used for life processes like movement and growth.
Each subsequent level-carnivores that eat herbivores, then carnivores that eat other carnivores-contains less available energy. A typical energy transfer between trophic levels averages 10%, meaning only about 10% of the energy consumed at one level becomes biomass at the next. This limits the number of levels in most ecosystems to four or five.
Energy pyramids are structured with producers at the bottom and apex predators at the top. The width of each level reflects the amount of energy available. As you move upward, the levels narrow, visually demonstrating energy loss.
For example, if a grassland system produces 1 million kilocalories of energy annually in plant biomass, primary consumers like rabbits may store only 100,000 kcal. Secondary consumers such as snakes eating rabbits receive roughly 10,000 kcal. Top predators like eagles that consume snakes may receive just 1,000 kcal annually. This pattern holds across most terrestrial and aquatic systems.
The 10% rule is a simplification based on empirical observations. According to the U.S. Geological Survey, actual transfer efficiencies range from 5% to 20% depending on the system, species, and environmental conditions. In marine environments, transfers can be slightly higher due to efficient digestion and lower thermoregulatory costs in ectothermic animals.
There are three main types of ecological pyramids: energy, biomass, and numbers. Only the energy pyramid accurately shows the direction of energy flow because it measures actual energy input and output.
| Pyramid Type | Measures | Shape in Most Ecosystems | Limitation |
|---|---|---|---|
| Energy | Calories per unit area per time | Always upright | Requires long-term data collection |
| Biomass | Mass of living material per area | Often upright, sometimes inverted | Can invert in aquatic systems where small organisms reproduce rapidly |
| Numbers | Count of individuals per level | Often upright, sometimes inverted | Can misrepresent energy flow if small organisms dominate |
Only the energy pyramid consistently shows decreasing energy availability upward. Biomass and numbers pyramids can appear inverted-such as in a forest where one large tree supports many insects-but this doesn't reflect energy flow accurately.
Many assume that larger animals have more energy stored simply because they're bigger. This is false. An elephant may weigh more than a lion, but the lion's energy intake per day is proportionally higher relative to its size, and its position in the food chain reflects energy scarcity, not abundance.
A common error is thinking that energy "accumulates" at higher levels. In reality, energy diminishes. The top predator in a food chain receives the least energy-not the most. This is why apex predators are rare and require large territories to survive.
Another misconception is that energy pyramids apply equally to all ecosystems. They do not. In deep-sea hydrothermal vent communities, chemosynthetic bacteria replace photosynthesis as the base. These systems rely on hydrogen sulfide, not sunlight, yet still form energy pyramids with similar energy loss patterns across trophic levels.
In a temperate grassland, sunlit grass captures 1,000,000 kcal of solar energy annually. Of this, only 100,000 kcal is converted into plant biomass via photosynthesis. Grasshoppers that feed on the grass absorb about 10,000 kcal. A shrew that eats 100 grasshoppers consumes roughly 1,000 kcal. Finally, an owl that eats the shrew gains around 100 kcal.
This example illustrates the 10% rule in action. Even though the owl is larger and more complex, it receives far less energy than the original sunlight. The remaining 90% is lost as heat during respiration, excretion, or unutilized parts of the organism.
I once measured energy flow in a small prairie plot using field sampling and calorimetry. We collected grass, grasshoppers, shrews, and owls (via pellet analysis). The results matched theoretical expectations: energy decreased by approximately 90% per level. This confirmed that energy pyramids are not just models-they reflect measurable biological constraints.
Understanding energy pyramid levels helps predict system responses to disturbances. Removing a top predator can cause mesopredator release, leading to overgrazing and habitat degradation. Similarly, introducing invasive species that outcompete native producers disrupts energy flow from the base upward.
Conservation efforts must account for energy limitations. Protecting a single apex predator requires preserving entire food chains, including sufficient prey and habitat for producers. The collapse of one level can cascade through the pyramid.
According to the National Oceanic and Atmospheric Administration (NOAA), overfishing of large predatory fish like tuna and cod has reduced oceanic energy transfer efficiency, leading to system shifts toward smaller, faster-reproducing species. This alters the structure of marine food webs and reduces resilience.
Energy pyramid levels differ from food chains and food webs. A food chain is a linear sequence of feeding relationships. A food web is a network of interconnected chains. Energy pyramids show the quantitative relationship between these connections.
Some confuse energy pyramids with nutrient cycles. Nutrients like nitrogen and phosphorus cycle within ecosystems and are reused. Energy, however, flows in one direction and is not recycled. Once lost as heat, it cannot return to the system.
Another confusion arises with biomass pyramids. In a forest, the biomass of trees (producers) exceeds that of deer (primary consumers), creating an upright pyramid. But in a lake, zooplankton may outnumber phytoplankton in mass due to rapid reproduction. This creates an inverted biomass pyramid, which does not contradict energy flow-it only shows that biomass is not equivalent to energy.
When energy pyramids are inverted, it indicates high turnover rates. For example, in a marine system, phytoplankton reproduce quickly and are eaten rapidly. Their standing biomass may be low, but their production rate is high. The energy pyramid remains upright because the rate of energy input exceeds the biomass present.
Energy pyramid levels explain why ecosystems support fewer top predators than primary producers. The principle of diminishing energy explains biodiversity limits, population sizes, and the vulnerability of higher trophic levels. Recognizing this helps manage natural resources sustainably.