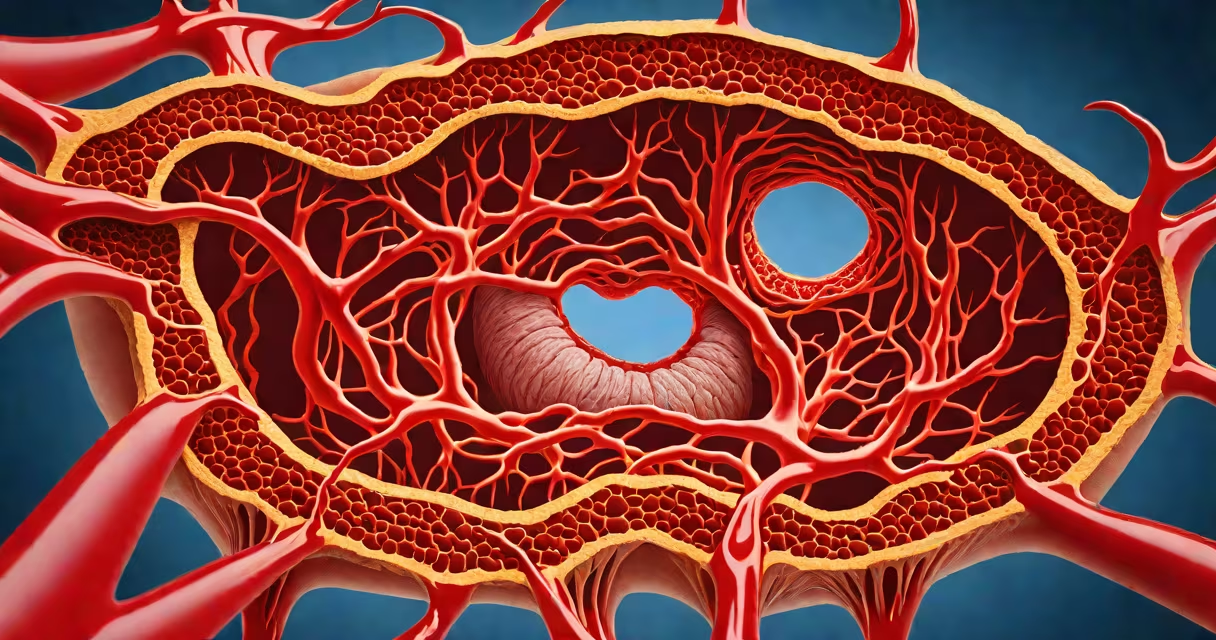
Total peripheral resistance is the sum of all forces opposing blood flow through the systemic vasculature, primarily in arterioles. It reflects how much effort the heart must exert to push blood through the body's network of small arteries and capillaries.
This resistance arises mainly from the diameter of arterioles-tiny vessels that regulate blood distribution based on tissue demand. When these vessels constrict, resistance increases; when they dilate, resistance drops. The relationship between vessel radius and resistance follows Poiseuille's law: resistance varies inversely with the fourth power of the radius. A 50% reduction in radius increases resistance by 16-fold.
Normal total peripheral resistance ranges from 1,200 to 1,800 dyn·s·cm⁻⁵ in adults. Values above 2,000 dyn·s·cm⁻⁵ indicate elevated resistance, often linked to hypertension. Clinically, it's derived using the formula: TPR = (Mean Arterial Pressure - Central Venous Pressure) / Cardiac Output.
Arterioles act as the primary control points for blood flow distribution. Their walls contain smooth muscle that responds to neural signals (sympathetic nervous system), hormones (norepinephrine, angiotensin II), and local metabolic conditions (oxygen levels, CO₂, pH).
For example, during exercise, muscles release metabolites like adenosine and lactate. These substances trigger local vasodilation in skeletal muscle arterioles, reducing resistance and increasing blood flow to meet energy demands. This happens even as systemic blood pressure rises due to increased cardiac output.
Conversely, under stress, sympathetic activation causes widespread vasoconstriction. This raises total peripheral resistance, elevating blood pressure to ensure perfusion to important organs like the brain and heart-even if it reduces flow to less critical areas like skin and gastrointestinal tract.
Total peripheral resistance is not uniform across the body. Resistance is highest in the renal and splanchnic circulations due to dense arteriolar networks. The cerebral circulation maintains stable resistance despite changes in systemic pressure-a feature called autoregulation.
Resistance is measured indirectly. Clinical values come from arterial pressure readings, central venous pressure (usually negligible in healthy individuals), and cardiac output, which is measured via echocardiography, thermodilution, or pulse contour analysis.
| Parameter | Typical Value | Units |
|---|---|---|
| Mean Arterial Pressure | 90-100 | mmHg |
| Cardiac Output | 5.0 | L/min |
| Central Venous Pressure | ~5 | mmHg |
| Calculated TPR | 1,600 | dyn·s·cm⁻⁵ |
A 2021 study published in Circulation Research confirmed that microvascular resistance in the forearm correlates strongly with long-term cardiovascular risk, independent of traditional factors like cholesterol and smoking.
Many confuse total peripheral resistance with systemic vascular resistance (SVR). While both refer to resistance in the systemic circuit, SVR is a calculated estimate used in clinical settings, whereas TPR is a physiological term emphasizing the integrated effect of all vascular beds.
Another frequent error is assuming that high blood pressure always results from high TPR. In reality, blood pressure (BP) equals cardiac output × total peripheral resistance. So, high BP can stem from increased cardiac output (e.g., hyperthyroidism), reduced compliance (e.g., aging arteries), or elevated TPR-but not necessarily all three.
For example, a 32-year-old woman with severe anxiety may have a resting systolic BP of 150 mmHg. Her cardiac output is normal at 6 L/min, and her mean arterial pressure is 110 mmHg. With a central venous pressure near 0, her TPR calculates to ~1,830 dyn·s·cm⁻⁵-above normal. But her elevated BP stems from sympathetic-driven vasoconstriction, not structural changes in arteries.
Elevated total peripheral resistance is a sign of essential hypertension. Over time, sustained high resistance forces the left ventricle to contract harder, leading to left ventricular hypertrophy-a known predictor of heart failure and sudden cardiac death.
Conversely, low TPR occurs in septic shock. In sepsis, inflammatory mediators like nitric oxide cause massive vasodilation. Blood pressure drops despite high cardiac output. TPR can fall below 500 dyn·s·cm⁻⁵, leading to distributive shock. Treatment focuses on restoring vascular tone with vasopressors like norepinephrine.
I once observed a patient with pheochromocytoma-a tumor secreting excess epinephrine-presenting with persistent hypertension. Despite normal cardiac output, their TPR was 2,400 dyn·s·cm⁻⁵. After surgical removal of the adrenal tumor, TPR normalized within 48 hours, confirming the role of hormonal overdrive in altering vascular resistance.
Resistance is not the same as impedance. Impedance includes inertial and capacitive effects seen in pulsatile flow, especially in large arteries. Resistance applies to steady-state flow. In most clinical contexts, resistance is sufficient for modeling.
Capacitance-the ability of veins to store blood-is distinct from resistance. Veins contribute to blood volume reservoirs, not resistance. However, venous return influences cardiac output, which in turn affects TPR calculations.
Renal function also modulates TPR. The renin-angiotensin-aldosterone system (RAAS) activates angiotensin II, a potent vasoconstrictor. Chronic RAAS overactivity leads to sustained elevation in TPR and contributes to salt-sensitive hypertension.
Understanding total peripheral resistance helps clinicians interpret hemodynamic instability. It explains why some patients with low blood pressure respond to fluids while others require pressors. It also informs drug choices: ACE inhibitors reduce TPR by blocking angiotensin II formation, while calcium channel blockers relax vascular smooth muscle directly.
Total peripheral resistance governs blood flow dynamics throughout the body. It is not a single entity but the net result of countless microscopic interactions across the vascular tree. Its accurate assessment remains central to diagnosing and managing cardiovascular disease.