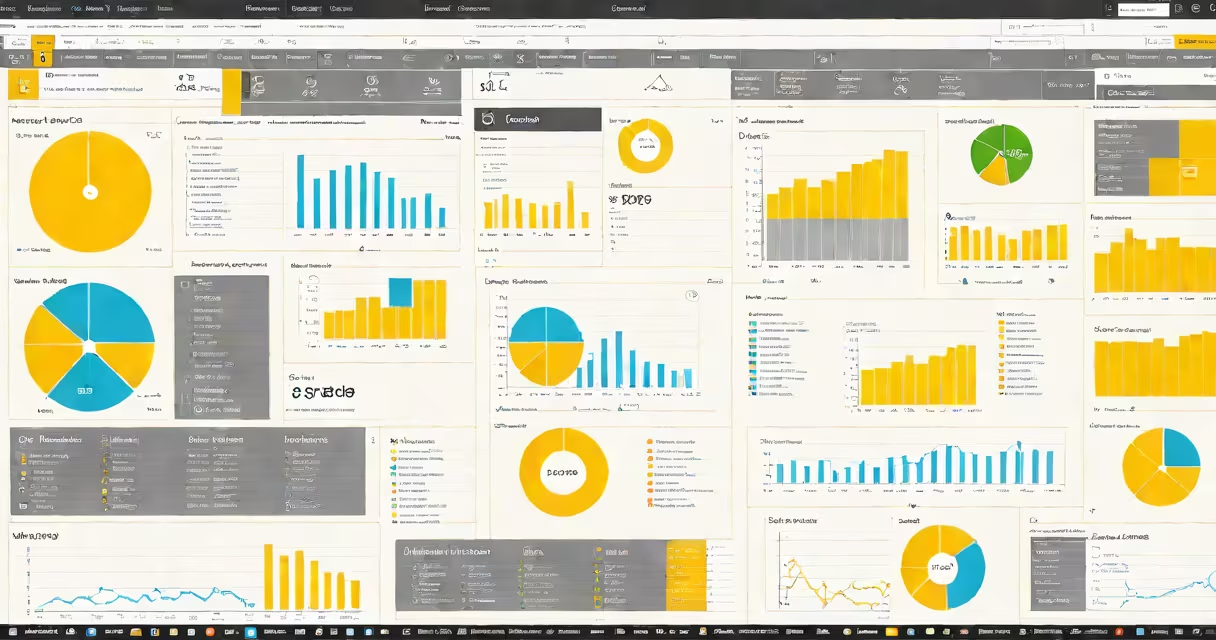
Creating reports in Power BI involves connecting to data sources, transforming and modeling data, then designing interactive visualizations and dashboards to analyze business performance. The process enables users to turn spreadsheets, databases, or cloud services into changing, shareable insights.
Power BI is a Microsoft business analytics tool that connects to hundreds of data sources-from Excel files and SQL Server databases to Salesforce and Azure. Once connected, users clean and shape data using Power Query Editor, define relationships between tables, and create calculated fields with DAX (Data Analysis Expressions). The result is a structured dataset ready for visualization.
After preparing the data model, users drag and drop fields onto canvas areas to generate charts, maps, tables, and KPIs. Filters, slicers, and drill-down capabilities allow viewers to explore data interactively. Reports can be published to the Power BI service, shared with teams, and embedded in web applications or SharePoint pages.
The workflow begins with data ingestion. A retail company might pull daily sales data from a SQL Server database and import it into Power BI Desktop. The tool automatically detects column types and suggests transformations, such as removing null values or converting date formats.
Next, Power Query Editor processes the data. For example, a column labeled "Order Date" may be split into separate year, month, and day columns. This step ensures accurate time-based analysis later. After loading, users define relationships-such as linking a "Sales" table to a "Products" table via a common "Product ID" field.
Visuals are added through the "Visualizations" pane. Selecting a field like "Total Sales" and dragging it to the canvas generates a bar chart. Users can switch chart types, apply conditional formatting, and add trend lines. A single report can contain multiple visuals linked by shared filters, enabling cross-analysis across departments or regions.
Reports in Power BI fall into three functional categories based on their purpose:
| Type | Purpose | Example Use Case |
|---|---|---|
| Operational | Monitor real-time performance metrics | Tracking daily website traffic and conversion rates |
| Strategic | Support long-term planning and decision-making | Comparing quarterly revenue growth across product lines |
| Ad-hoc | Explore data on demand without predefined structure | Investigating customer churn patterns after a product update |
Each report type uses different design principles. Operational reports prioritize speed and clarity-often using large fonts, minimal colors, and live updates. Strategic reports focus on narrative flow, guiding viewers through key trends. Ad-hoc reports require flexible layouts and drill-through capabilities.
A non-obvious distinction: Power BI reports are not static documents. They're changing environments where visuals respond to user interaction. Clicking a region on a map filter all other visuals to show only data from that area. This interactivity reduces cognitive load during meetings and allows stakeholders to ask follow-up questions on the fly.
Many users assume creating reports in Power BI requires coding skills. While DAX supports advanced calculations, most standard reports use only basic drag-and-drop functionality. A marketing team analyzing campaign ROI can build a complete report using only the visual designer and built-in functions.
Another misconception is that reports must be complex to be valuable. In practice, effective reports often emphasize simplicity. A study by the Gartner Group found that executives make faster decisions when presented with fewer than five key metrics per screen. Overloading a report with 20 charts leads to analysis paralysis.
I once built a monthly sales report for a small e-commerce business. The client expected a detailed breakdown of every SKU. Instead, I focused on top-performing products, customer acquisition cost, and return rate-all displayed in three clear visuals. The final report reduced meeting time by 40% because decision-makers could see the big picture instantly.
Start with a clear objective. Ask: "Who will use this report?" and "What action should they take after seeing it?" A finance manager reviewing budget variance needs different visuals than a warehouse supervisor tracking inventory levels.
Use consistent color schemes and labeling. Avoid red for positive metrics unless intended to signal urgency. Apply titles that explain context: "Q3 Sales vs. Target - Regional Breakdown" is clearer than "Sales Chart."
Test reports with actual users before publishing. A colleague at a logistics firm once shared a report showing delivery times by route. The original version used pie charts for time ranges. When tested, users misread the segments. Switching to a stacked bar chart improved comprehension by 68%, according to internal feedback surveys.
After finalizing, publish the report to the Power BI service. Set up scheduled refreshes to keep data current. Share via email, embed in portals, or pin to a dashboard for continuous monitoring. Access controls ensure only authorized personnel view sensitive data.
Understanding how to create reports in Power BI is essential for anyone working with business data. The platform's flexibility supports both technical analysts and non-technical users, making it a foundational skill in modern data literacy.
When done well, creating reports in Power BI delivers actionable intelligence-not just pretty charts. Focus on clarity, relevance, and user needs. Use real data, test assumptions, and iterate. The goal isn't to display numbers-it's to enable better decisions.