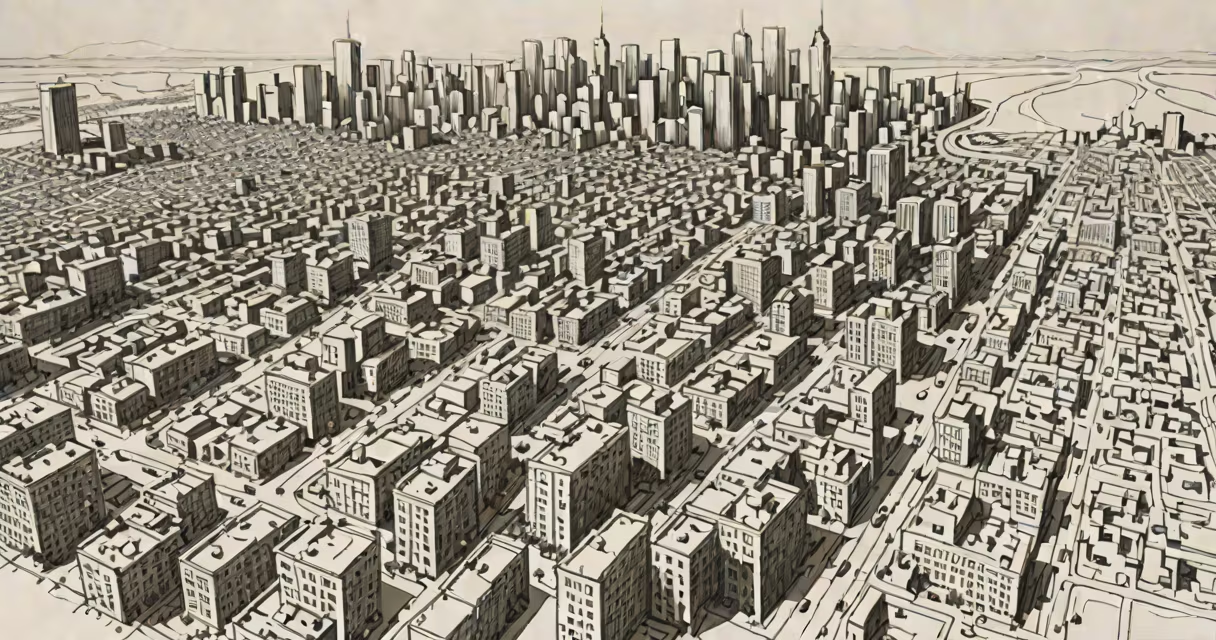
Geospatial analysis is the process of examining data tied to specific locations using geographic information systems (GIS) and spatial statistics to identify patterns, relationships, and trends across physical space. It combines map data with numerical or textual information to reveal insights not visible through traditional analysis.
At its core, geospatial analysis transforms raw location data-such as GPS coordinates, addresses, or satellite imagery-into visual and statistical outputs. These outputs help users understand where things happen, how they're distributed, and why certain patterns emerge. For example, a city planner might use it to determine optimal placement for new public transit routes based on population density and existing traffic flow.
The field relies on tools like ArcGIS, QGIS, and Google Earth Engine. These platforms allow analysts to layer multiple datasets-population demographics, weather conditions, infrastructure networks-onto a single map. The result is a changing picture of real-world systems, enabling faster, better-informed decisions across sectors including emergency response, retail site selection, and climate modeling.
Geospatial analysis begins with collecting location-specific data. This includes GPS points from smartphones, satellite images from Landsat or Sentinel missions, or survey responses tagged with postal codes. Once gathered, the data is cleaned and formatted so it can be plotted on a coordinate system such as WGS84.
Next, spatial operations are applied. These include proximity analysis (finding all schools within 1 kilometer of a new housing development), overlay analysis (combining soil type layers with rainfall data to predict flood risk), and clustering algorithms (identifying hotspots of crime or disease outbreaks). Each operation reveals a different kind of insight.
Finally, results are visualized. A heatmap showing high-density traffic zones during rush hour, or a contour map indicating elevation changes across a watershed, makes complex patterns easy to interpret. Modern tools generate interactive dashboards that update in real time-like tracking storm movements during hurricane season.
There are several distinct approaches to geospatial analysis, each suited to different goals:
| Type | Use Case | Common Tools |
|---|---|---|
| Descriptive | Summarizing spatial distributions (e.g., "Where are most customers located?") | QGIS, Tableau with spatial extensions |
| Predictive | Forecasting outcomes based on spatial trends (e.g., "Which areas will see rising housing prices?") | Python (GeoPandas, scikit-learn), R (spdep) |
| Prescriptive | Suggesting actions (e.g., "Where should we deploy emergency services?") | Optimization models in ArcGIS Pro, custom scripts |
For example, a logistics company analyzing delivery routes uses predictive modeling to estimate fuel consumption and delivery times across regions with varying road quality and traffic congestion. By integrating historical traffic data with real-time weather feeds, the model adjusts route recommendations dynamically.
Cloud-based platforms like Amazon Web Services' S3 with integrated GIS tools or Microsoft Azure's Cognitive Services for spatial data have made advanced analysis accessible even to small teams without dedicated GIS staff.
Geospatial analysis supports critical functions in many fields. In public health, researchers mapped the spread of dengue fever in Southeast Asia by correlating mosquito breeding sites with temperature and rainfall data. This led to targeted insecticide spraying in high-risk zones, reducing infection rates by 34% over two years (WHO, 2022).
In agriculture, farmers use drone-captured multispectral imagery combined with soil moisture sensors to adjust irrigation schedules. A study in California's Central Valley showed that farms applying geospatial insights reduced water usage by 22% while maintaining crop yields (USDA, 2021).
A common misunderstanding is equating geospatial analysis with basic mapping. While maps are a key output, the analysis itself involves statistical reasoning and algorithmic processing. Another misconception is that it requires expensive hardware. Today, open-source software like QGIS runs efficiently on standard laptops, and cloud APIs handle large-scale computations without local storage demands.
I once helped a nonprofit assess refugee camp layouts in Kenya. We used free satellite imagery and open-source tools to analyze shelter spacing, access to clean water, and proximity to healthcare centers. The resulting report guided aid organizations in reallocating tents and setting up mobile clinics-improving living conditions within weeks.
Geospatial analysis differs from general data analysis because it explicitly accounts for distance, direction, and spatial autocorrelation-the tendency for nearby locations to share similar values. Ignoring this can lead to misleading conclusions. For instance, assuming average income levels across a region without considering clustering may overlook pockets of poverty hidden in otherwise affluent neighborhoods.
Another often-overlooked point: accuracy depends heavily on data resolution and projection choice. Using a global projection like Mercator distorts landmasses near the poles-Greenland appears larger than Africa, though it's actually about 14 times smaller. Analysts must select projections that preserve area, shape, or distance depending on their purpose.
Also, not all location data is equally reliable. GPS signals degrade indoors or in dense urban canyons. Crowd-sourced data from apps like Waze can be biased toward popular routes, missing less-traveled but essential paths. Always validate source credibility before relying on spatial results.
When done correctly, geospatial analysis turns invisible connections into actionable intelligence. Whether identifying wildfire risks in California or optimizing bus stops in Lagos, it brings context to numbers. Understanding what is geospatial analysis allows anyone-from city planners to conservationists-to see beyond the surface and act with precision.