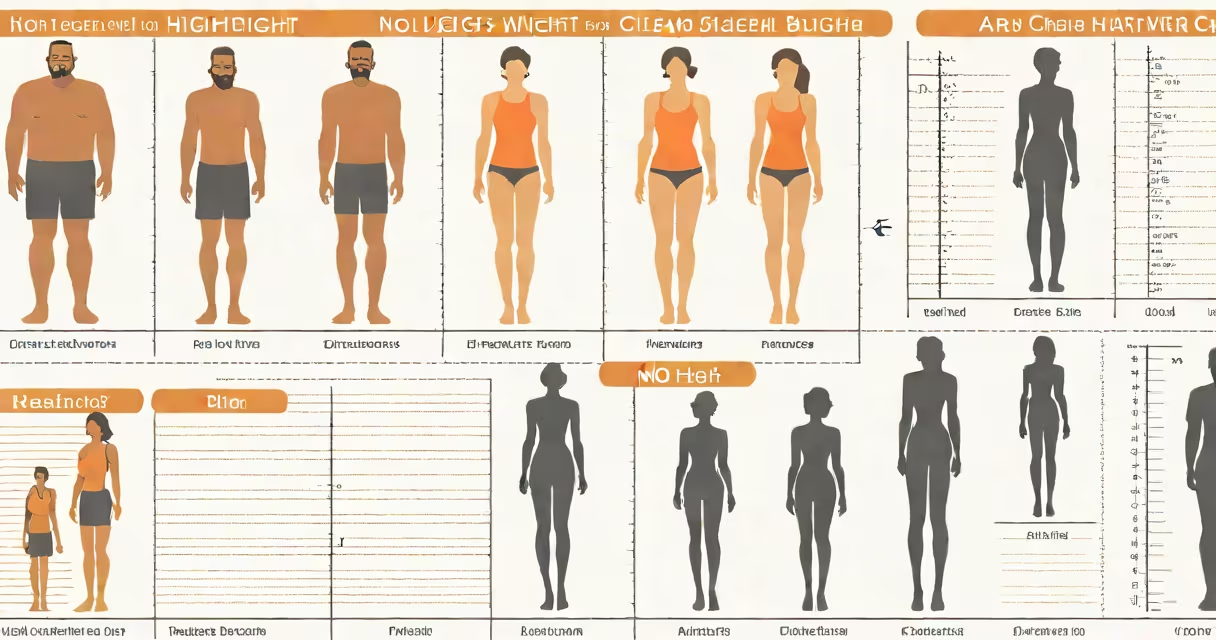
A height and weight chart for men and women provides standardized weight ranges corresponding to specific heights and genders, used to estimate whether a person's weight falls within a healthy range based on clinical benchmarks. These charts are derived from population data and are often paired with Body Mass Index (BMI) thresholds to assess health risk.
Such charts are typically developed using large-scale health surveys. The Centers for Disease Control and Prevention (CDC) uses data from the National Health and Nutrition Examination Survey (NHANES) to define average height and weight distributions for U.S. adults. For example, the CDC reports that the average height for adult American men is 5 feet 9 inches (69 inches), with a median weight of 197.9 pounds. For women, the average height is 5 feet 4 inches (64 inches), with a median weight of 168.5 pounds.
These values form the basis of most public health charts. A height and weight chart for men and women is not a diagnostic tool but a reference point. It helps identify potential weight-related health risks when a person's weight falls above or below expected ranges for their height and sex.
Charts map height on one axis and weight on the other, with color-coded zones indicating underweight, normal, overweight, and obese ranges. The most common method uses BMI categories: underweight (<18.5), normal (18.5–24.9), overweight (25–29.9), and obese (≥30).
For example, a man who is 5'10" (70 inches) and weighs 180 pounds has a BMI of 25.8, placing him in the overweight category. A woman who is 5'5" (65 inches) and weighs 130 pounds has a BMI of 22.1, which falls within the normal range. These calculations are automated in most official charts.
The charts assume a linear relationship between height and ideal weight, but they do not account for muscle mass, bone density, or body composition. A muscular athlete may fall into the "overweight" zone despite being fit and healthy. This limitation is well documented in research published by the American Council on Exercise (ACE), which notes that BMI-based charts can misclassify individuals with high lean mass as overweight.
There are several types of height and weight charts, each serving different purposes:
| Type | Use Case | Source | Limitation |
|---|---|---|---|
| CDC Growth Charts | Standard for clinical screening in primary care | CDC NHANES data | Based on U.S. population; less applicable globally |
| BMI-Based Charts | Public health education and insurance assessments | WHO and CDC guidelines | Does not measure body fat distribution |
| Body Composition Charts | Used in fitness and sports medicine | DEXA scan and bioimpedance data | Requires specialized equipment |
Most consumer-facing charts use BMI as the metric. The World Health Organization (WHO) defines a healthy BMI range as 18.5 to 24.9 for both men and women. However, this range is not uniform across ethnic groups. Research from the National Institutes of Health (NIH) shows that Asian populations have higher risk of metabolic disease at lower BMIs compared to White populations, meaning the same BMI threshold may not apply equally.
One non-obvious fact: the term "ideal weight" is misleading. Charts don't define a single ideal weight. Instead, they show a range. For example, a man who is 5'8" (68 inches) has a healthy weight range of 140 to 170 pounds, depending on frame size and activity level. The concept of "ideal" implies a single number, but health professionals prefer the term "healthy weight range."
Many people mistake a height and weight chart for men and women as a personal prescription. It is not. A chart provides a general guideline, not a medical diagnosis. A person can be within the "normal" range and still have poor metabolic health, especially if they carry excess visceral fat.
Another error is assuming that weight is the sole indicator of health. A man who is 6 feet tall and weighs 220 pounds may appear overweight on a chart, but if he exercises regularly and has low body fat, his health markers-like blood pressure, cholesterol, and insulin sensitivity-may be excellent. Conversely, someone within the "normal" BMI range can have high visceral fat and increased risk of heart disease.
I once used a height and weight chart during a wellness workshop to screen participants. One woman, 5'6" and weighing 145 pounds, was flagged as "normal" by the chart. But her waist circumference was 38 inches-above the recommended threshold for women (35 inches)-and her fasting glucose was elevated. She had metabolic syndrome, despite a normal BMI. This reinforced that charts are tools, not final verdicts.
Use a height and weight chart for men and women when assessing general health trends in populations or identifying individuals who may benefit from further evaluation. They're useful in school health screenings, employee wellness programs, and initial consultations with healthcare providers.
Do not rely on them alone for individual assessment. A person's health status requires more than height and weight. Waist-to-hip ratio, blood tests, physical activity levels, and family history provide better insight. The American Heart Association recommends combining BMI with waist measurement and blood work for accurate risk assessment.
Understanding a height and weight chart for men and women begins with recognizing its purpose: to offer a quick reference, not a definitive health score. Use it as a starting point, not a conclusion.