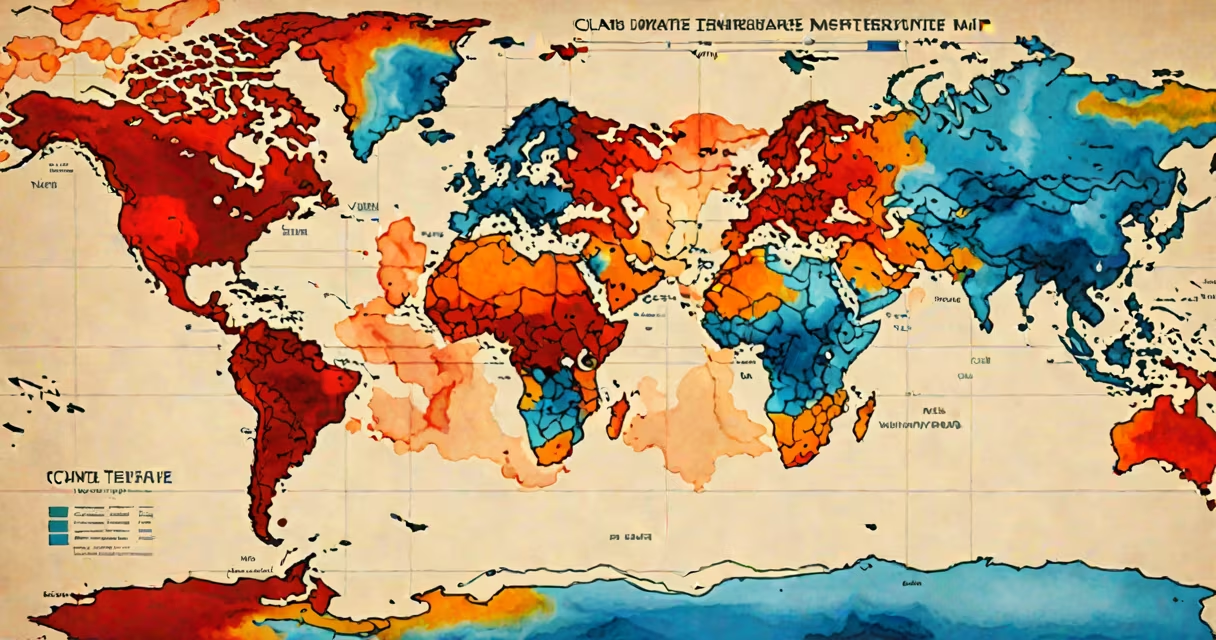
A global temperature map is a visual representation of Earth's surface temperatures across geographic regions, using color gradients to show variations from freezing to tropical heat. These maps are generated from satellite observations, weather station data, and ocean buoys, updated daily or hourly during major climate events.
Such maps are not static images. They are changing datasets processed through algorithms that correct for sensor drift, cloud cover, and measurement bias. For example, NASA's MERRA-2 reanalysis system combines 40 years of satellite and ground-based observations to produce consistent temperature fields. The European Centre for Medium-Range Weather Forecasts (ECMWF) uses similar models to generate high-resolution global maps every six hours.
Color scales define temperature ranges: blue indicates below-freezing conditions, green and yellow represent temperate zones, and red-orange tones mark hotspots above 30°C (86°F). A single pixel on a standard global map covers roughly 10 kilometers by 10 kilometers, allowing users to spot regional anomalies like urban heat islands or marine heatwaves.
Global temperature maps rely on multiple data streams. Satellites such as NOAA's Suomi NPP and the joint NASA-JAXA Aqua mission collect infrared and microwave emissions from Earth's surface and atmosphere. These signals correlate to temperature values. Ground stations measure air temperature at 2 meters above the surface, while ocean buoys record sea surface temperature (SST).
Data from these sources undergo quality control. Outliers-such as a sensor malfunction reporting -50°C in the Sahara-are flagged and removed. Then, interpolation fills gaps using nearby readings. This process creates a continuous grid. The resulting product is a time-stamped raster image, often stored in NetCDF format for scientific use.
For public-facing tools like the Climate Reanalyzer or NOAA's Climate.gov dashboard, the raw data is further simplified. Colors are adjusted for human perception, and features like coastlines and borders are overlaid. Maps are typically rendered at 1-kilometer resolution for desktop views and 5-kilometer for mobile access.
Different types of global temperature maps serve distinct purposes. Here's a comparison:
| Type | Primary Data Source | Update Frequency | Use Case |
|---|---|---|---|
| Surface Air Temperature | Weather stations, satellites | Hourly to daily | Tracking heatwaves, seasonal changes |
| Sea Surface Temperature | Satellite infrared sensors | Every 6-12 hours | Monitoring El Niño, hurricane formation |
| Land Surface Temperature | Thermal infrared imaging | Twice daily | Measuring drought stress, fire risk |
| Upper Atmosphere Temperature | Radio occultation, lidar | Once per day | Studying stratospheric warming, ozone depletion |
Each type focuses on a different layer of Earth's environment. For instance, sea surface temperature maps were critical in predicting the intensity of Hurricane Dorian in 2019. SSTs exceeded 30°C (86°F) in the Atlantic, fueling rapid intensification. Forecasters used real-time maps to issue early warnings, reducing casualties.
Many assume a global temperature map shows actual surface heat. But it reflects measured radiation, not direct touch. A desert may appear hotter than a forest even if the forest feels cooler to humans. The map measures emitted energy, which depends on albedo (surface reflectivity), humidity, and wind speed.
Another mistake is equating short-term spikes with long-term climate trends. A 2023 map showed parts of Siberia reaching 40°C (104°F) in June-a record for the region. That event was driven by a persistent high-pressure system, not climate change. However, when such extremes recur over multiple years, they signal systemic shifts. The World Meteorological Organization (WMO) notes that 2023 was the hottest year on record, based on 140 years of data, not isolated map snapshots.
Some confuse global temperature maps with climate models. While both use temperature data, models simulate future states under various emissions scenarios. Maps show current reality. A model projection for 2050 might show the Arctic turning green, but a map from 2024 shows ice still covering most of it.
In July 2023, a global temperature map from the Copernicus Climate Change Service revealed a persistent heat dome over Europe. Red zones stretched from Spain to Poland, with temperatures exceeding 40°C (104°F) in cities like Madrid and Budapest. The map highlighted a 5-day period where average surface temperatures rose 5°C above normal.
Emergency services used the map to prioritize cooling centers. Public health officials issued advisories based on the data. Afterward, researchers analyzed the map alongside historical records and confirmed that such heat domes had increased in frequency since 1980. The study, published in Nature Climate Change, found a 300% rise in extreme heat events across southern Europe.
I once used a global temperature map during a field trip to monitor wildfire risks in California. By overlaying real-time temperature data with vegetation moisture levels, we identified a dry zone near Lake Tahoe where fire spread was likely. The map helped us reroute a research team before smoke closed roads. It wasn't perfect-cloud cover masked some areas-but it gave actionable insight within minutes.
Other tools include the Global Historical Climatology Network (GHCN), which hosts archived maps dating back to 1880. Researchers use these to detect long-term warming trends. The University of Alabama in Huntsville runs a satellite-based temperature tracker that updates every 24 hours, showing atmospheric temperature anomalies.
For personal use, apps like Windy or AccuWeather display simplified versions of these maps. They're less precise but useful for travel planning. If you're checking your local forecast, you're seeing a truncated version of the same science behind the full global map.
Understanding a global temperature map isn't about memorizing colors. It's about recognizing patterns in Earth's thermal behavior. Whether tracking a storm, assessing climate risk, or studying biodiversity loss, these maps deliver immediate context. They turn complex data into visual stories that anyone can read.